Tampilkan postingan dengan label Foreign Exchange Trading. Tampilkan semua postingan
Senin, 12 Maret 2012
YEN Crosses - Time to Rest & Reverse?
AUDJPY Weekly.
Looks like H&S, doesn't it?
AUDJPY Daily.
Looking for 105 and below if the Resistance at 110 holds, however it seems like forming a lower Top.
EURJPY Weekly.
Trend is still down. Ichimoku cloud is still making it hard for the Longs.
EURJPY Daily.
Same here. Betting on Lower Top formation + overextended momentum technicals.
GBPJPY Weekly.
Rather non-spectacular performance these last 2 years for "The Beast". Still under pressure.
GBPJPY Daily.
Overextended techs and weak below the past Resistance levels around 130. Looking for a revisit of 126 at least.
Selasa, 25 Oktober 2011
Fading the Euro Optimism
EUR/USD Daily chart looks like stalling at the 55-Day MA at 1.39 just shy of the 61.8% Fibo at 1.40.
It seems like too much effort has been wasted on pulling that stunt so far - 5 days in row tight range and with usd/jpy finally dropping to punish all those easy believers in the BOJ magic + the dissapointment of the EU summit time looks ripe for some reaction.
In addition the 55-Day MA at 106.74 doesn't look like easy beam to hop above.
Kamis, 13 Oktober 2011
FX Majors ( € ~ £ ~ ¥ ) ::: Trading the RANGE
Kapri Just entered those positions based on the assumption we are trading in the established range:
Short EUR/USD 1.3782
Short GBP/USD 1.5768
Long USD/JPY 76.88
Risk on a breach & close above yesterday Highs & Lows respectively, so looking to add in that space until the inflection point is not compromised.
Short EUR/USD 1.3782
Short GBP/USD 1.5768
Long USD/JPY 76.88
Risk on a breach & close above yesterday Highs & Lows respectively, so looking to add in that space until the inflection point is not compromised.
~ ~ ~
EUR/USD
Daily chart show 1.3850 as a major Resistance level (50% of 1.4555 - 1.3147).
GBP/USD
Daily chart show 1.5789 as a major Resistance level (38.2% of 1.6627 - 1.5272).
USD/JPY
Yen finally started moving after the extremely tight range congestion in the last 2 weeks.
Yen has appreciated to multi-year highs and MOF/BOJ wouldn't be feeling comfortable with these levels, hence the fear in the market with an FX market intervention. Given that premise the LONG side is favored.
One can use both the 76.30 and 76.78 as SL levels - or one could average till 75 if the price goes that way on the assumption the BOJ will defend those multi year lows in USD/JPY.
Rabu, 12 Oktober 2011
EUR/USD & GBP/USD Rally's Resistance Ahead
Market looks very short the contis and that is reflected in those over-extended moves in the EUR/USD and GBP/USD. It might be short covering and stop hunting.
Just as a reference we have solid Resistance areas ahead and majors are very close to these inflection points.
> Resistance layer on EUR/USD is between 1.3836 (July Low) and 1.3855 (50% of 1.4560-1.3149).
> Resistance area on GBP/USD Res at 1.5778 (July Low) and 1.5837 (Upper Bollinger Band).
-------
Daily ranges are over extended based on historical averages so I'm fading these moves with low leverage.
Jumat, 19 Agustus 2011
Jumat, 29 Juli 2011
Global Macro Update: Gold - EURUSD - Euro Stoxx 50 - 10Y Bund
Trend Channel Upper line shows 1645 as a potential target. First Support lies at the 1578 previous High in confluence with the 20-Day SMA.
EURUSD is trading right on the middle ground of the recent 1.40 - 1.46 range Supported by the converging 20 & 72-Day SMAs. Downside the 200-Day SMA holds the key at the major psychological 1.4 level.
DJ Euro Stoxx 50 Index is trending down with scope of 2599 Lower Channel trendline.
10-Year German Bund is trending up amid growing economic concerns and US and EZ Periphery Debt problems. Previous High at 131 is an obvious target for the current directional move.
Kamis, 14 April 2011
EUR/USD Trend Channel suggests a move above 1.45

A simple 4H chart suggest we see some more filling the 1.44-45 range before a continuation along the trend above 1.45. My guess is the large intra-day swings we saw in the recent days were meant to shake off the weak longs and get more small fish that shorted on the move below 1.4450 on the boat before the true move above 1.45 starts.
Rabu, 30 Maret 2011
Kamis, 03 Maret 2011
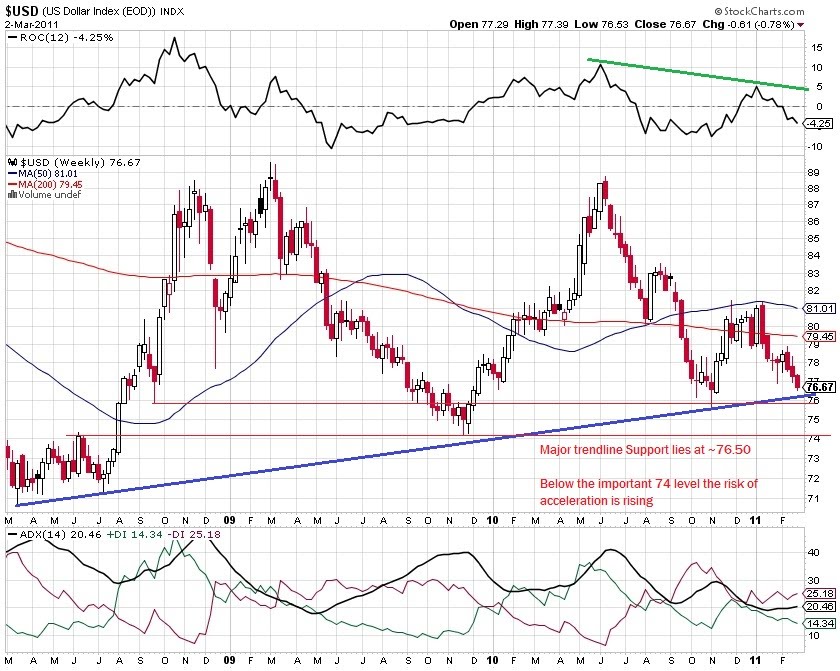
US Dollar Index (DX) is nearing a crucial Support level at 76.50

Chart by Global-view.com.
The 2-year EZ-US bond spread is favoring the EURUSD appreciation and a decisive close above 1.39 would most likely bring acceleration to the present trend.
US Dollar Index (DX) is trading near crucial long term support trendline which comes around 76.50. A break below opens the avalanche scenario of major slide in the USD while the FED is reluctant to hike rates and the ECB is starting to relay hawking signs.
Kamis, 24 Februari 2011
S&P 500 Breaks the Uptrend Support
Rabu, 23 Februari 2011
USD/CHF buy signal

Swissy is trading on a Support level that held the last 2 breakdown attempts and technical indicators are close to giving a buy signal.
I might be a bit early for the move up the risk around 0.9343 is fairly good given the potential reward of targets around 0.9550 and a potential break of 0.96 with scope of the upper resistance band around 0.9780.
Rabu, 19 Januari 2011
US Dollar Index Reversal tracking the Flattening 2Y-10Y UST Spread

The chart shows an extremely tight correlation of the US Dollar Index to the 2Y/10Y UST Notes Spread. The strength in the USD has been fueled by the Steepening in the spread following the Nov '10 announcement of the QE2 program.
This however seems to have run its course and the spread is turning flat along with the violent reversal in the USDX last week. This might be linked to an undergoing allocation into bonds or the effect of the ongoing bond purchases by the FED as the rate rise is postponed for the time being.
The reversal of the USDX ahead of the Resistance at the 200-DMA is a bearish sign and the ADX reading is signalling a pending Trend strengthening of the down move. RSI and Momentum indicators basically reflect the range trading conditions since Dec '10.
The EUR/USD staged a strong recovery off the 1.29 Support level as indicated in previous posts.
I had to rethink my thesis for USD strength in light of the latest developments and I assume the market will focus now on the unfolding Large Uptrend Channel as marked on the chart.
Trade wise I'd like to see a close above 1.35 for the 1.37 target to come in focus. I expect the price to lift into the 1.35-1.37 range for the next week. The bullish bias in the EUR/USD is present and only a close below 1.3240-50 would negate the present momentum and will force the market to re-think the current scenario.
Jumat, 07 Januari 2011
FX Review: Majors and the USD Bullish case

Major currencies are all giving their gains to the US Dollar with once exception: the Canadian Dollar. According to a Research report by the Bespoke Investment Group (http://www.bespokeinvest.com/thinkbig/2011/1/5/country-market-caps.html) "With a gain of 0.54 percentage points, Canada saw the biggest increase in percent of world market cap in 2010."
For the technical levels on the various currencies, please look at the brief technical annotations on the chart attached.
Against the dominant notion of the effects of FED's QE2 program the USD has been on a surge since the announcement of the plan in Nov '10. Technically the break of the 80 psychological level is a sign of strength seen also in the RSI and just recently the ADX Buy signal.
The grand battle should happen at the flat 200-DMA at 81.66 which if overtaken will result in a trend acceleration. Euro-zone Peripheral Debt problems coupled with the pending pullback in major Equity indices and Commodities would see a flight to safety into USTs and thus will boost the current trend in USD. This is a scenario in the making so I'm watching it vigilantly how it will play out.
This chart gives a vague idea of the correlation in the move of the UST 10-Year Yield and the current USD trend. Since mid Oct'10 the Yield starts to lead the direction of the USD which is presently lagging a big portion of the move and thus I assume an acceleration once the 200-DMA in the USD Index is taken out.
Kamis, 06 Januari 2011
EUR/USD needs to hold above 1.3055

EUR/USD 4 hour chart:
The pair needs to hold above the 1.3055 crucial Support in order to fend off the bearish momentum which would overtake the market once below that level.
Market is currently sitting on a thin Support trendline around 1.31 and the Support cluster area 1.3082-85 and the 1.31 big Figure. The current drop in EUR/USD will be negated only after the pair regains decisively the 1.3270 level.
Below 1.3055 the Bearish scenario focuses on the 1.2966 Low and the consolidation range in the 1.2640-1.2920 area.
Rabu, 22 Desember 2010
EUR/USD sitting on crucial Long Term Support

EUR/USD is bouncing off the crucial Support area around 1.3076 (50% Fib) and the 200-Day MA at 1.3095.
It has bounced off the test of 1.30 support and now is trading off a long term trendline in confluence with the 200-DMA. For that to play out we need to see at least 2 closes above the short term 21-DMA which is tracking the current downtrend.
The medium term momentum framed by the downward trend channel however is pointing to 1.28 (61.8%) and 1.244 (76.4%) if the 200-DMA gives way decisively.
Rabu, 15 Desember 2010
EURUSD equality amidst 1.3440 - 1.3230 range

Weekly Chart shows a giant Wedge in the making but the last top around 1.42 failed to test the Resistance Trend line so it adds an overall bearish sentiment to the big picture.
Price action is struggling below all major MAs (21 - 55 - 144) and it implies that if the 50% Fibonacci level (1.3433) of the last move is not regained decisively (which is a confluence Resistance area along with the 21-Week MA at 1.3372) a test of the latest base around 1.26 is following.
Monthly chart shows the significance of the 144-Month MA which held the last move down to 1.19 which coincided with the 50% Fib retracement.
Kamis, 11 November 2010
EUR/USD and PIGS Bond Spreads - Trend Reversal
Kamis, 04 November 2010
AUD & CAD Counter trend plays
Jumat, 22 Oktober 2010
Kamis, 21 Oktober 2010
US Dollar Index (DX) reversal based on the AB=CD pattern
Langganan:
Postingan (Atom)