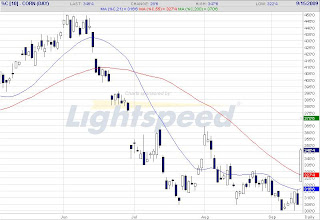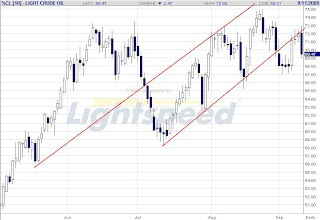
Here is a Monthly chart of the JGB performance.
Barron's magazine ran a story this week, which made the case the Japanese economy is a ticking debt time bomb (maybe the leader of a pack of time bombs across the industrialized world). Total population in Japan is falling fast, and falling even faster is the working age population to support Japan's massive debt to GDP ratio, measured officially at around 217%, that compares to 81.2% for the US and an average of 72.5% for the G-20 nations, according to Barron's. (blackswantrading.com/)
Interesting to me is how is it possible to maintain a debt to GBP ratio over 200% and still manage to market your massive debt. the chart shows that JGBs are in the 128 - 142 range for the last 10 years and still remain strong with all time low yields..


