Tampilkan postingan dengan label Futures. Tampilkan semua postingan

Rabu, 22 Februari 2012

Global Macro: Stocks are poised to collapse on the back of rising Crude and Debt. USD a necessary evil.


ZeroHedge published an interesting piece on the US Debt to GDP ratio passing the 101% mark:

So it is imperative to see the implications on the USD Index as a representation of the credit in the world reserve currency.


Obviously on the grand scheme the US Dollar Index is right in the middle of nowhere - it's in the average of the 6 year range after staging an impressive rally in the second half of the 2011. Now we are puzzled which one is worse the printing press of the FED or the sanity of the EU monetary union. And as the chart says we are equally poised to avert both of them so we are left right in the middle.

ZH shows that the FED debt monetisation is supported by the FED itself along with the next 2 most indebted global powers - UK & Japan. So what choise you are left if you want to diversify away from the Dollar?

GBP? Look at the economy and the scale of Debt-to-GDP ratio?
JPY? At the time it makes all time highs and the BOJ & MOF are desparate to weaken it through never ending interventions?
EUR? With the Greeks and the Italians and the Irish and the Spaniards?
How about Chinese RMB or Russian roubles?

Or simply buy Gold at the historic Highs and pray it is a true safe haven in the time of pending inflation. The Debt monetisation of the FED has been fueling the Stock rally in the last 3 months and the S&P 500 is making new High close to the H1 2011 High.


Problem is what stocks will do when commodities breakout on the upper end. Case in point Crude oil breaking above $105 and making things worse for the producers and transportation.


This simple fact finds an evidence in the classical technical analysis convergence between the Dow Jones Industrial Average (DJIA) and the Dow Jones Transportation Average which by the classic Dow Thoery are necessary to confirm each other and this obvious divergence calls for a breakdown.


Rabu, 22 Desember 2010

Momentum Divergence in GOLD: Pending Short signal


GOLD is Media's favorite anti-inflation play. Inflation expectations for 2011 are predominantly Flat as I watched a GS economist on CNBC today. So what happens in an overcrowded position?

Technically I see a Momentum Divergence. Rate of Change and RSI are ticking down while the price is consolidating with a slight upward Tilt.

ADX has been indicating a strong Trend however with +/-DIs closing the Spread it develops intoa classic Short signal based on Welles Wilders's own work.

Minggu, 07 Maret 2010

Markets falling towards Complacency?


VIX falls near its recent low and is nearing the 15 level which marks the Complacency entry mark..

Given the lows around 9 - 10 in 2007 where market was roaring in the 'Good times' it turns that market has remained most of the last 8 months in a state of relative balance and is going into an even more relaxed state.


.............................................................................

S&P 500 is holding nice gains after it corrected 9% in January.

The major index is trading in an Rising Wedge pattern and current target is around the key 1200 level which is in confluence with the 200-Week MA at 1227.

Both RSI and MACD are turning up supporting the move and the 50-Week MA is tracking nicely the Uptrend. This a great educational experience to have 1 straight year of roaring trend while we incessantly hear of a new crash, crisis, depression... Trade the trend!


.............................................................................


USD index is playing the indecision game for 4-th week right on the 200-Week MA at 80.39.

The technical picture shows that DX is trading inside a clear Uptrend Channel. However in the present moment it is a range play capped by the long term important 81.40/50 level and downside is holding around the 79.50 (Trendline Support) and 79.17 (50-Week MA).

Since the last Weekly settlement was at 80.46 I'd suppose a test of the Support layers in the 79-80 region (which might translate into EUR/USD test of 1.3750-1.38 levels) before DX tests the upside.

Jumat, 19 Februari 2010

Crude Oil gives bullish signs


Daily chart says it all:

RSI trending up.

DI & MACD both gave bullish crossovers.

Since the test of the 200-DMA at $68 Crude is 12% and solidly moving in a tight trend channel.

I included an interesting trendline which however gives a warning signal. I will be looking for a close above it for a confirmation of the Bullish scenario.

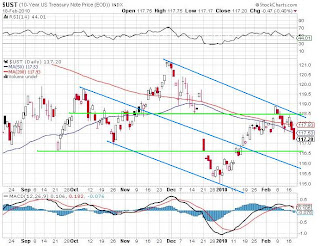
US Treasury Bonds Selloff - follow-up call


I'm happy I made that call right on top of the market and it did selloff after it. I didn't have position so it is only an intellectual satisfaction with my analysis.

After yesterday FED raised the Fed borrowing window to 0.75 bp it makes sense to think on the aggregate intelligence of the market - seems markets were anticipating that move so they started creeping higher 2 weeks prior to the actual news was released.


2 / 10-year bond spreads are signalling a possible steepening which is bullish for the economy.

While on dailies the moves are pretty rangy the Weeklies have strong signals on technical indicators as well as inside the trending channel that the spreads is moving toward steepening.


10-year UST Note yiled bounced off the 3.60% support and is moving higher with first target/resistance around 3.85/89.


10-year UST Note has an immediate target around 116.90 with further focus on 116.50.


Kamis, 04 Februari 2010

10-Year US Treasury Notes - Sell!


UST 2/10 Year bond spreads are further flattening which usually has bearish implications for the economy.


10-Year Yields are at an important Resistance turned Support above 3.60%.

Trend is supported by the 50-DMA, however the reversal pattern suggests further downside is possible.


10-Year UST Notes are a Sell now that they hit the central balance point of the last 2 swings.

Trading below the 50 & 200-DMAs with falling RSI and MACD about to give bearish crossover Notes are a sell until we see a close above 118.

10-Year yields bounced off the former Resistance turned Support at 3.60 and are heading for the recent 3.85 highs.


Minggu, 31 Januari 2010

Bond Spreads - flattening doens bode well for economic recovery


Weekly chart show bond yields are trading in ranges. While it's easily visible in the 2-Year UST Bills - the 10-Year Notes are still trading inside 3.20 - 3.85 area.

10-Year Notes however in my opinion are trending higher as we now have covered the December 2009 Gap and holding above the 40-Week MA. Historical charts show evidence that since the high inflation times of the '80-ies and Paul Volcker Bond prices are still in their historical high end range and if markets are indeed mean reverting in their nature Yields are going to go up further. The timing of the exit strategy by the Fed that will signal the tightening phase is impossible for me to suggest.


The 2Y/10Y Bond Spread Steepener trade in December 2009 has fully reversed its course into Flattening one since start of 2010. When we look at the Weekly chart of the Spread we can observe the trend channel and its a flattening one and this seems to bode ill for the economic recovery that we witnessed in the latest US GDP release.


Selasa, 19 Januari 2010

USD Index correlations with SPX, Gold & 10-Year US Treasury Notes' Price


December 2009 risk taking/averting correlation trade broke down. Now seems SPX is moving higher along with USD appreciation as the overlay suggests.


Gold corrected but the long-term trend is still holding above the bullish trendline.

The USD Index is looking like developing the Bullish Flag formation. I am skeptical of seeing Gold rally along with USD rally and I'm looking which one will break as I lean to the idea that Gold will correct further.


There is a cyclical pattern here in the 10-Year UST Note price and the range trade till Dec 2009 was going along the gradual depreciation of the USD.

Since Dec 2009 we have a pronounced bond selloff accompanied with USD rally which is maybe cashing out to buy on lower levels as bond yields will be watched vigilantly and they are certainly not liked above 3.60/70 as they put pressure on mortgage holders.

This is certainly a critically important factor and I'm watching closely for the developments here.

Jumat, 08 Januari 2010

USD Index (DX) COT positioning favors USD longs

USD Index COT shows Commercials and Large traders are positioned as they were in Sept 2008.

The vertical lines show the extreme expansions and the points where the Commercials and large traders flipped from long to short and vice versa.

The obvious recap from the chart is that until the Commercials are hedging their USD downside the trend in USD is UP.

Rabu, 06 Januari 2010

Crude Oil (NYMEX) in Ascending Triangle Pattern - $82 breakout level to watch

Crude Oil has been consolidating below 82 nearly 2 months in 2009 and after a brief retreat to 70 it is back on track with a trend fueled by rising momentum as ADX is above 22 and going higher.

RSI is going along and rising steeply.

The trend has been steady since the bounce off 70 level and the Resistance at 82 should be really tough.

However if that level gives way there should be at least another 12 point rally on he other side of that line.

Kamis, 10 Desember 2009

S&P500 bounced off long-term support trendline - focus on 1121

it is very interesting to see yesterday's low in S&P has bounced off the long term Support line - I'd expect more risk taking and a test of the major 1121 level (50% fib 2007 top to 666 bottom).

Gold is sittign right on 34-day MA

I was interested to see Gold sitting right at its 34-Day MA (1120.06).

think its also on a previous Gap (1120) Support and it well worth for a spike to 1155 Gap resistance as marked on the chart.
..............

We have contracting range days in EUR/USD -- it has 3 consecutive days with minor higher lows right at 89-day MA - - this distribution of stops on OANDA' site actually supports a possible run to 1.4850 (55-day MA).. seems like short term bottoming pattern and the tighter ranges will sure has a break since tomorrow is Friday..

Senin, 07 Desember 2009

SPX (S&P500 Index) is tighening its range - get ready for next move!


Friday's move was accompanied by a high volume we haven't seen since September.

The current consolidation range is locked between 1080 and 1121 and looking at the contraction in the Bollinger Bands I'd look for a breakout move soon enough. Interesting is that there are 3 marginal higher highs ending with Friday last week. Today we didn't have significant test of the downside and Since start of November S&P has been trading above the pivotal 20-Day MA.

There is a slight divergence with the falling RSI and the rise in ATR is a sure sign for a pending rise in volatility. 1121 level is quite important as being 50% retracement level of the whole move into the 668 lows.

Sabtu, 05 Desember 2009

Gold - how about a top?


I waited for a long time to see some sign of reversal. Here are my points of assuming the Top is in place right now.

Friday's move close wiped out 2 weeks of ascent. The move since October formed an Ascending Broadening Wedge which if broken would give a target at $1025. The only problem right now is Friday's candle probed he T/L Support but closed right at the Line and also still above the 21-Day MA (1153,43).

RSI has already given Sell signal and ADX formed a top high above the DI- & DI+ which are now about to cross. According to Welles Wilder, who created those indicators, this formation with the ADX high above both the DI-&DI+ is a very good indication of a Trend reversal. There were 2 previous occurrences in September and October, however due to the strength of the trend they only yielded a shallow retraces.

Last take on the Reversal or at least the start of the Distribution phase is the rise in volatility. Average True Ranges are going through the roof to a year highs with 2 days of more than $60 range in last 2 weeks after we have been used to a $20 range. Watch it closely and go with the flow!


Sabtu, 28 November 2009

Gold in Parabolic trend


Gold managed to close higher for 4-th straight week just shy of $1200 mark.

ADX shows a solid strength in the move and trendlines support the assumption we are seeing the acceleration phase that will most likely result in a blow off top. I believe going with the trend is the best solution however I'm looking for early signs of topping. The sharp drop from 1194 to 1140 on Thursday, when Dubai news hit the market, in my opinion reveals the vulnerability of this relentless rise.

Already 15.5% above the previous top (1033) - Gold will have to deal with the psychological 1200 level. My first working scenario is a trend continuation. if next week we see aclose above 1200 I'd bet that we will witness even stronger buying frenzy and the acceleration might easily help the precious metal tp climb till 1220-30.

The other assumption would be that we don't touch 1200 and go straight down to 1145-25. While the RSI has been climbing steadily for the last 5 months we can see the indicator is topping and the ADX also adds similar implications as the +DI component already advanced to a new high. Fundamental themes and news flow will dominate next week as global markets will have to digest the Dubai status. That means more uncertainty and probably a lot more volatility. The Average True Range is rising which would be an early indicator for a possible start of the distribution phase characterized by high volatility and wide range trading until the distribution of the inventories is finished and the new trend ill begin,

Minggu, 22 November 2009

10-Year US Treasury Note on the Rise - Critical Resistance at 120.17/38


10-y US Treasury Note - Weekly chart: Price is close to probing the Upper Bollinger band at 120.17. Next important Resistanc ecomes in 120.38 - the 55-Week MA.

Price consolidates with upward bias inside a rough range between 117 - 120. I'm looking at the ATR indicator for further implications of change in Volatility. There is a solid trend of range contraction and we are on the level of the Average True Range we have seen in March and September 2008. Mu take on this picture is that ranges if falling below the current 1.66 range that would most likely signal trend continuation. 55-Week MA is acting as fulcrum axis pointing the trend. Given the convergence is pivotal 55-WMA and the Upper Bollinger Band around 120.17/38 my opinion is that we might see a further advance and expansion of the BBands which would fit in the trend breakout scenario.

The Dec '08 -> March '09 Highs Trendline has already been broken the Week before and last weeks higher high is acting as confirmation to this setup. RSI is supporting the upward momentum.

S&P 500 - momentum is fading


Weekly chart shows indecision represented by last weeks forming a tiny Doji with only a marginal new High. RSI & ADX both are losing steam.

I'm looking for first test of 1065-70 level and the critical 1025 below which the uptrend will signal retreat. Price is right at the middle of the Rising Wedge pattern so we need to watch for test of the Support or for a possible squeeze to new highs - the latter seems rather difficult to me.

Crude Oil (Nymex) - Triangle break & Critical Support at 75.80 (200-Week MA)


There are 2 technical scenarios to approach the present structure of the Crude Oil's trend. However the both rely on the Critical importance of the 200-Week MA at 75.80.

First and most obvious is the Ascending Triangle breakout above 75 that happened in October. The upside is coinciding nicely with the 200-Week MA and the measured target is around $91.

Second scenario is if the Trendline Support that comes in around 76 will hold the rise. The RSI is holding a steady run above the average and that is positive for the scenario.

It is however a curious development that we have 3 weeks of indecision marked by the 3 Dojis which are also spinning tops as the Highs of all coincide. While Gold marches higher relentlessly these 3 weeks of tight range might be considered a warning to the Bulls as most obvious patterns recently failed to materialize.

Gold's relentless rise


Gold is up 69% from the Oct 2008 Lows around $680 and already 11% above it's previous $1033 top. While the trend has the momentum and the fundamental underpinning to proceed I would like to look for contrarian signals.

Just to asses the present moment we have a RSI reading high like in Nov '08 and March '09 - that saw corrections. The Trend strength measured by the Wilder's ADX is reaching the 25 threshold thus signalling the solid momentum of the movement.

As Welles Wilder had written there is a good sign for going against the prevailing trend when the ADX rises above both the +DI & -DI. The timing and the money management is critical to the success of taking such signal as we can see such a setup occurred in Jan '08 but it wasn't until the end of March '08 that the intermediate high at 1033 was reached and the correction ensued.

Pattern-wise I drew a tentative Rising Wedge wich projects a Resistance around $1175-80 level.
The stock indices become weaker and while the might be some Christmas window dressing I see the exponentially rising of the Gold Trend as a precursor of the next bout of stock indices fall.

Selasa, 17 November 2009

S&P500 shows signs of exhaustion


The 7 month run of the S&P is exhausted and the momentum is already missing.
RSI and Slow Stochastics are both suggesting that a pullback is imminent - the question remaining is if it would be a short term, intermediate or a long term top?

While I'm far away from the perma-bear state of mind - there is a great chance that the illusion of the end of the "greatest recession" since "The Great Depression" was just cheap liquidity pumped into the system to lift the asset valuations. However Debt ratios remain extremely high and job market is still very weak - that means that consumption and private investments will be scarce and the economic growth can't go on on government spending only - not to mention the gigantic US debt issued in the the last 2 years.

Purely technical picture would suggest we are inside the primary trend channel (red), however the Momentum is already slowing and the price is making only marginally higher highs/ higher lows. The Sideways range channel in the last 2 months confined the advance of the move.

Last weeks advance has been followed by the indecision pattern of 2 consecutive Doji candlestick days. 1100 level is psychological Support and below we go for the 50-Day MA that held all previous corrections. However I doubt this time we will have much support there as I see a fast move towards 1025-50 area where initially the trendline support will pause the price decline.