Tampilkan postingan dengan label Bulgarian Stock Exchange. Tampilkan semua postingan

Selasa, 25 Januari 2011

SOFIX - Trendline Breakout Confirmed


SOFIX has now a confirmed Trend line break and targets the psychological Resistance at the 400 level. A break above will make the market focus on higher Resistance levels: 428 / 469 and the 2009 top above 500.
Risk is on a dive back below the broken trendline the odds of which diminish greatly with the rise of inflation and the global recovery we are monitoring in major markets. The money will soon start to flow from the center to the periphery again and frontier markets like Bulgarian Stock Exchange will find its spot under the sun.

Selasa, 28 Desember 2010

SOFIX breaks Long term Trendline Resistance


SOFIX is testing a break above the long term Trendline Resistance in confluence with a second attempt to gain hold above the 100-Day MA.

If this test is confirmed by 2 consecutive positive closes First target is the 400 psychological mark and then 442-446 area.

Kamis, 19 Agustus 2010

SOFIX trend update


The major Bulgarian Stock Exchange Index - SOFIX bounced off 360 level of Support vigorously but I'd like to mention a few points of caution before we cheer the rise.

The chart clearly shows a series of Lower lows/highs and until this is changed it would be early to call a trend reversal.

400 level is a Major Pivot and a sentiment indicator as it clearly turned from Resistance into Support and now it would be again a serious test for the Bulls. Indicator-wise RSI is in deeply Overbought area and it is a sign of caution. If we see continuation of the upmove it might hang in there for a while but still we might see a powerful correction until 400 is decisively cleared and technical indicators are favorable for a Long position.

On the other side the Upmove is supported by the Trenline support coming off the Feb 2009 Lows and also price is hanging above the 100-Day MA, which however is pretty flat and it suggest we could just have a prolonged period of sideways consolidation.

Rabu, 18 Agustus 2010

SOFIX breaks the Wedge pattern to the Upside

Following my last chart view of the major Bulgarian stock index - SOFIX from May 16, 2010:

I present an update on the market action.


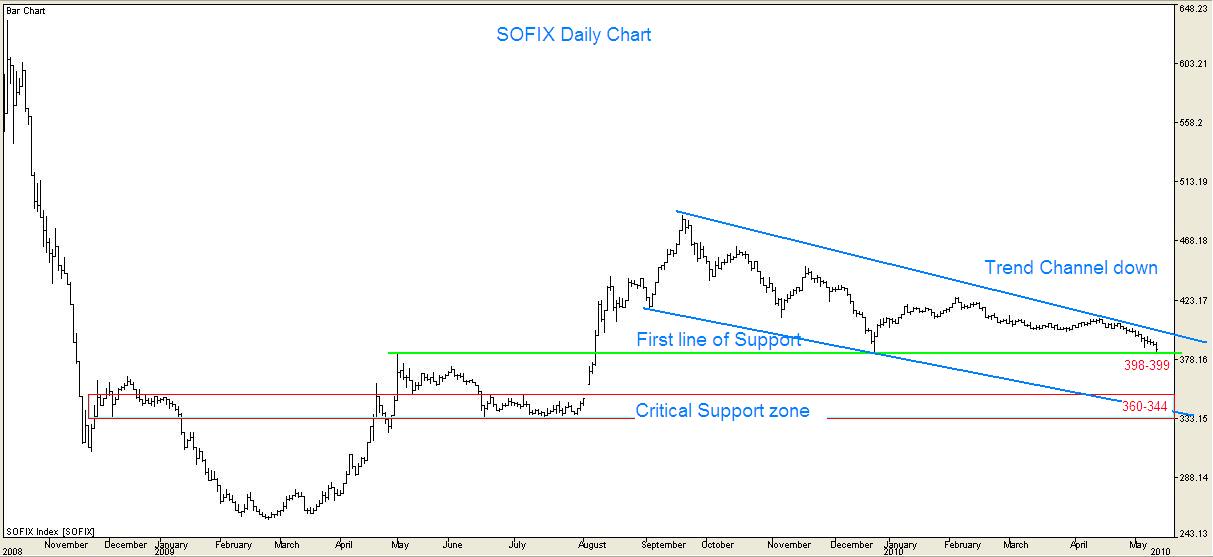
Back then I wrote: "Technically the index is moving inside the Trend Channel which is the first Support at 398-399 is broken decisively with a close below will run into the Critical Support area at 360-344 where the Trendline support confluence is located. ... The important spot below 399 is the August 2009 Gap (360-380) which is begging to be filled by any textbook example. So the focus is if the confluence of the 344 support and the Trend channel bottom will provide the sufficient cushion for a reversal."

Indeed 360 level got tested 3 times and proved a hard Support from which stocks bounced for a swift rise into the 390-400 Resistance Area. The break to the Upside is shown as a breakout from a Falling Wedge pattern which is typically a strong Bullish sign. I expect however in the mid term some consolidation in the 380-400 area before the uptrend continues. Only a fall and close below 380 would turn on the bearish sentiment again.

Minggu, 16 Mei 2010

SOFIX testing first Support at 398-399


Following the Feb 25, 2010 post:

SOFIX is still trending down and last week just broke the previous low and tested the 398 Support level. Technically the index is moving inside the Trend Channel which is the first Support at 398-399 is broken decisively with a close below will run into the Critical Support area at 360-344 where the Trendline support confluence is located.

That scenario depends on the breakdown of the 398 level but since we just run into the SELL in May and Go Away mentality and the S&P crashed ahead of the 50-Day MA (1174) Resistance it is most probably that we are back to the global correlation on the way down (since we kinda missed the move up that most of the Developed and Emerging Markets enjoyed).

The important spot below 399 is the August 2009 Gap (360-380) which is begging to be filled by any textbook example. So the focus is if the confluence of the 344 support and the Trend channel bottom will provide the sufficient cushion for a reversal.

Rabu, 24 Februari 2010

SOFIX Trend line Support broken down


Here's an updated chart of SOFIX.

The trendline Support that was mentioned last week didn't hold and there is a close lower that puts attention to the downside scenario that is laid out on the present chart.

SOFIX is trading currently in a Downtrend Channel marked with Red.

The most important balance point is roughly in the 380 zone as it is 50% of 515-250 range so far.
The previous Resistance now turned Support at 397-399 is the first level to be tested if the Trendline break is sustained this week. The testimony of Ben Bernanke seemed to please the US stock markets and Crude finished on the high of the day which by all means risk is turning back on the table with the re-affirmation of the low rates to be kept for considerable time.

That actually is puzzling as it must favor all markets. There is however the idea of the divergence trade as the liquidity in the Developed markets pushes all asset class prices and while US entered first in the Global Financial Crisis they are the first to emerge from it with repaired balance sheets and faster deleveraging - a process that lags in the Emerging Markets and especially in peripheral markets like SOFIX.

Tight fiscal and especially the fixed monetary policy slow down the deleveraging process of investors and fresh money doesn't flow in consumption and/or investment but to replenish the consumer balance sheets. Or that is just another convenient explanation.

Jumat, 19 Februari 2010

SOFIX - Trend Channel


The major Bulgarian Stock Exchange index - SOFIX is developing an interesting trend channel.

Trendline support has been tested this week and while the index is looking vulnerable to a further plunge there is also the alternative case of the Support holding and that in sync with the global risk appetite seen in all asset classes this week following the FED's rate hike.

There is an increasing number of signs that the inflationary trade is actually in progress with treasury yields creeping higher while bond vigilantes are selling US bonds to punish the huge deficits and low yields paid - case in point USTreasury 10-Year Note gapped and closed even lower today. You can check in the blog my call on the Bond Selloff from Feb 04.

SOFIX has a critical Support level at 399/400 level as shown on the chart and the Gap support lower at 360 is a level one wouldn't want to see broken for it might signal a test of 2009 lows.

While I'd like to see the channel bottom line holding another bullish sign is the classic 20 x 50 Day MA Golden cross. RSI is slightly negative and MACD is coiling in a pattern similar to the previous 2 times the upmove started as marked.

Technical observations just help develop a scenario and define risk points - next week will see if the current setup will prove correct or a failure of the trend line support will move focus on the 400 important level.

Kamis, 18 Juni 2009

Emerging Markets & Emerging Europe trends break down


Emerging Markets brkoe down the trend channel and are targeting the 55-DMA at 30.31.
Upside is capped by the 21-DMA at 32.86 and it should serve a good R?R Stop-loss level for a short trade looking for a test of the 200-DMA at 26.60.

RSI & ADX both are confirming the downtrend direction and strength.
_ _ _ _ _ _ _ _ _ _ _ _ _ _ _ _ _ _ _ _ _ _ _ _ _ _ _ _ _ _ _ _ _ _ _ _ _ _ _ _


Emerging Europe is the next best thing to watch as a proxy to the sentiment of the Bulgarian Stock Exchange-Sofia.

The obvious breakdown of the trend channel match the Emering Markets technical view with supports and targets at the 55 and 200-DMAs (30.47 and 27.94). The short sell trade has a risk of reversal to the long side at the 21-DMA which negates the bearish view.

RSI and ADX are both clearly showing there is a downtrend in progress at present so we stick with he short side until there a divergence is observed.

Senin, 13 Oktober 2008

SOFIX - 585 - 10.10.2008

I saw Sofix 575 had a support level..

I entered when Sofix close at 585 on 10.10.2008

6000 shares - MONBAT /5MB/

4000 shares - CHIM /6C4/

3000 shares - EUBG /4EH/
------------------------------------
today monday 13.10.2008 seems a reversal is in the works - a bull rally in bear market actually

Dow closed like 800 points up - from a bottom at 7 890 - to a intrtaday high at 9 440...

----------------------

however my losses in FX and futures keep me crashing - my 'wealth' shinks too fast in the last 2 months...

Rabu, 10 September 2008

SOFIX and BG Stock Exchange

well my secong or maybe third attempt to long the SOFIX shares proved another failure and I exited in the end of August 2008 with a 30% loss.

I tried to long CHIM /6C4 at below 7.95 - had 10 000 shares at that price and then some 2000 more in the 8.70 and 8.50 area -- unfortunately the move was weak and I even had to sell from 8.35 till 7.95 so it was a failure again.

The big stake of 8800 share in EUBG/4EH I had for a repo-credit that I bought around 5.20 I had to sell around 4.80.

FIB / 5F4 also was weak and I sold it around 5.85 but now it looks better and holds above 6...

I watch the main indices close as I'm very intereseted how the post bubble effects will affect the market.

Senin, 07 Juli 2008

Stock Portfolio Rebalancing - 07.07.2008

Today I rebalanced my Stock Portfolio on the Bulgarian Stock Exchange - Sofia.

I dumped the old holdings of:
1. Alcomet
2. Doverie United Holding

they were both very poorly performing - the Alcomet P/E has risen above 58 and the basic materials were giving it a huge toll over earnings.
Doverie I believe is watering the stock holdings as he new shares are in the market the value has long ago disappeared.
>>> I know I was dead late for this move - worse I don't find any reason for consolation - I was reckless and overstayed bad trades

Alcomet - long average at 1760 for around ~ 9.30
liquidated ~ 6.70

Doverie - long 2000 around 10 - liquidated at 6.60-80

>>> all the freed capital is invested now in the doubled position of Eurohold - today 8888 shares.

Senin, 30 Juni 2008

Possible Double Bottom formations - 30.06.2008


Here are the major and the broad indices - Sofix & BG40.
The charts suggest possible Double bottom formations >>
thus I decided to hold my investments in the major companies.
The portfoilo consists of 9 positions with slight bias to the financial sector as I suspected a rebound there to be stronger than the market as a whole.
However I realise the stock market is actually dominated by the infractructure companies and financials seems to have lost their shine.
The plan is to liquidate the BSE stock holdings on the subsequent rallies as I expect the overall economic conditions to get better for the time being in the US and the Euro zone but the Autumn to bring some very bad consequences of the credit crisis expansion.

Minggu, 17 Februari 2008

BG40 Weekly - 17.02.2008


BG40 Weekly chart gives a clear view how the bear market has stalled its decline above the 345 level - a breakout gap support that if broken targets the 260 level where a breakaway from the price base emerged

SOFIX Weekly - 17.02.2008


SOFIX Weekly chart update - bear market rally seems to stall at the previous high around 1420 --- next Support level test comes at 1222 - with scope turned to 968 last Strong base if 1222 gives way..

Kamis, 07 Februari 2008


'Blue chip' SOFIX continues the descent -- Rising triangle breakdown targets the Yearly Support line ~1155
__________
Declining RSI 20 confirms the downtrend momentum.

Sabtu, 02 Februari 2008

SOFIX Weekly - 01.02.2008


The 'blue-chip' index SOFIX just like the broader market index BG40 shows more downside to be seen before a strong base is set for a reversal to the long term uptrend.

Basic elements like the cross of the 20 & 50 week MAs confirm this imminent scenario and MACD points to a continuation of the downward momentum.

A good point for a reversal and building a solid base should be the 1150 level where we have a confluence of a Long term trend line support and a major low.

Of course we can't argue with the tape - market will show if I am right or wrong.